Analyze. Interpret. Canvas. Share.
From raw data to shared insight — in one browser-based platform.
From upload to insight — four steps.
No learning curve required. AnalyZ guides you from raw data to shareable findings in one session.
Upload spreadsheets, SPSS files, Word docs, or plain text — or connect directly to KoBo, ODK, REDCap, or Google Sheets. Variable labels imported automatically.
Run any analysis — frequency tables, statistical tests, interview coding, relationship mapping. Quantitative and qualitative in the same session.
Every result comes with a plain-English explanation. Sense Making ties all your analyzes into one coherent narrative when you're ready.
Publish a live dashboard with cross-filtering, or a data story with charts and participant quotes — both shareable as a link. No account needed to view.
Powerful insights should be accessible to everyone.
Too many researchers, evaluators, and practitioners doing meaningful work are blocked by expensive licenses, steep learning curves, or tools that handle numbers or words — never both.
AnalyZ Solutions changes that. One platform. Browser-based. Free to start.
Four things no other tool gives you together.
Other tools give you one or two of these. AnalyZ gives you all four — in a single platform, with no installation required.
One platform. Two worlds.
Bridging human intelligence to AI.
Most people juggle separate tools for numbers and interviews — two learning curves, two licenses, and a manual bridging exercise in between. AnalyZ brings it all into one workflow.
- Quantitative: data management, visualisation, and statistical analysis
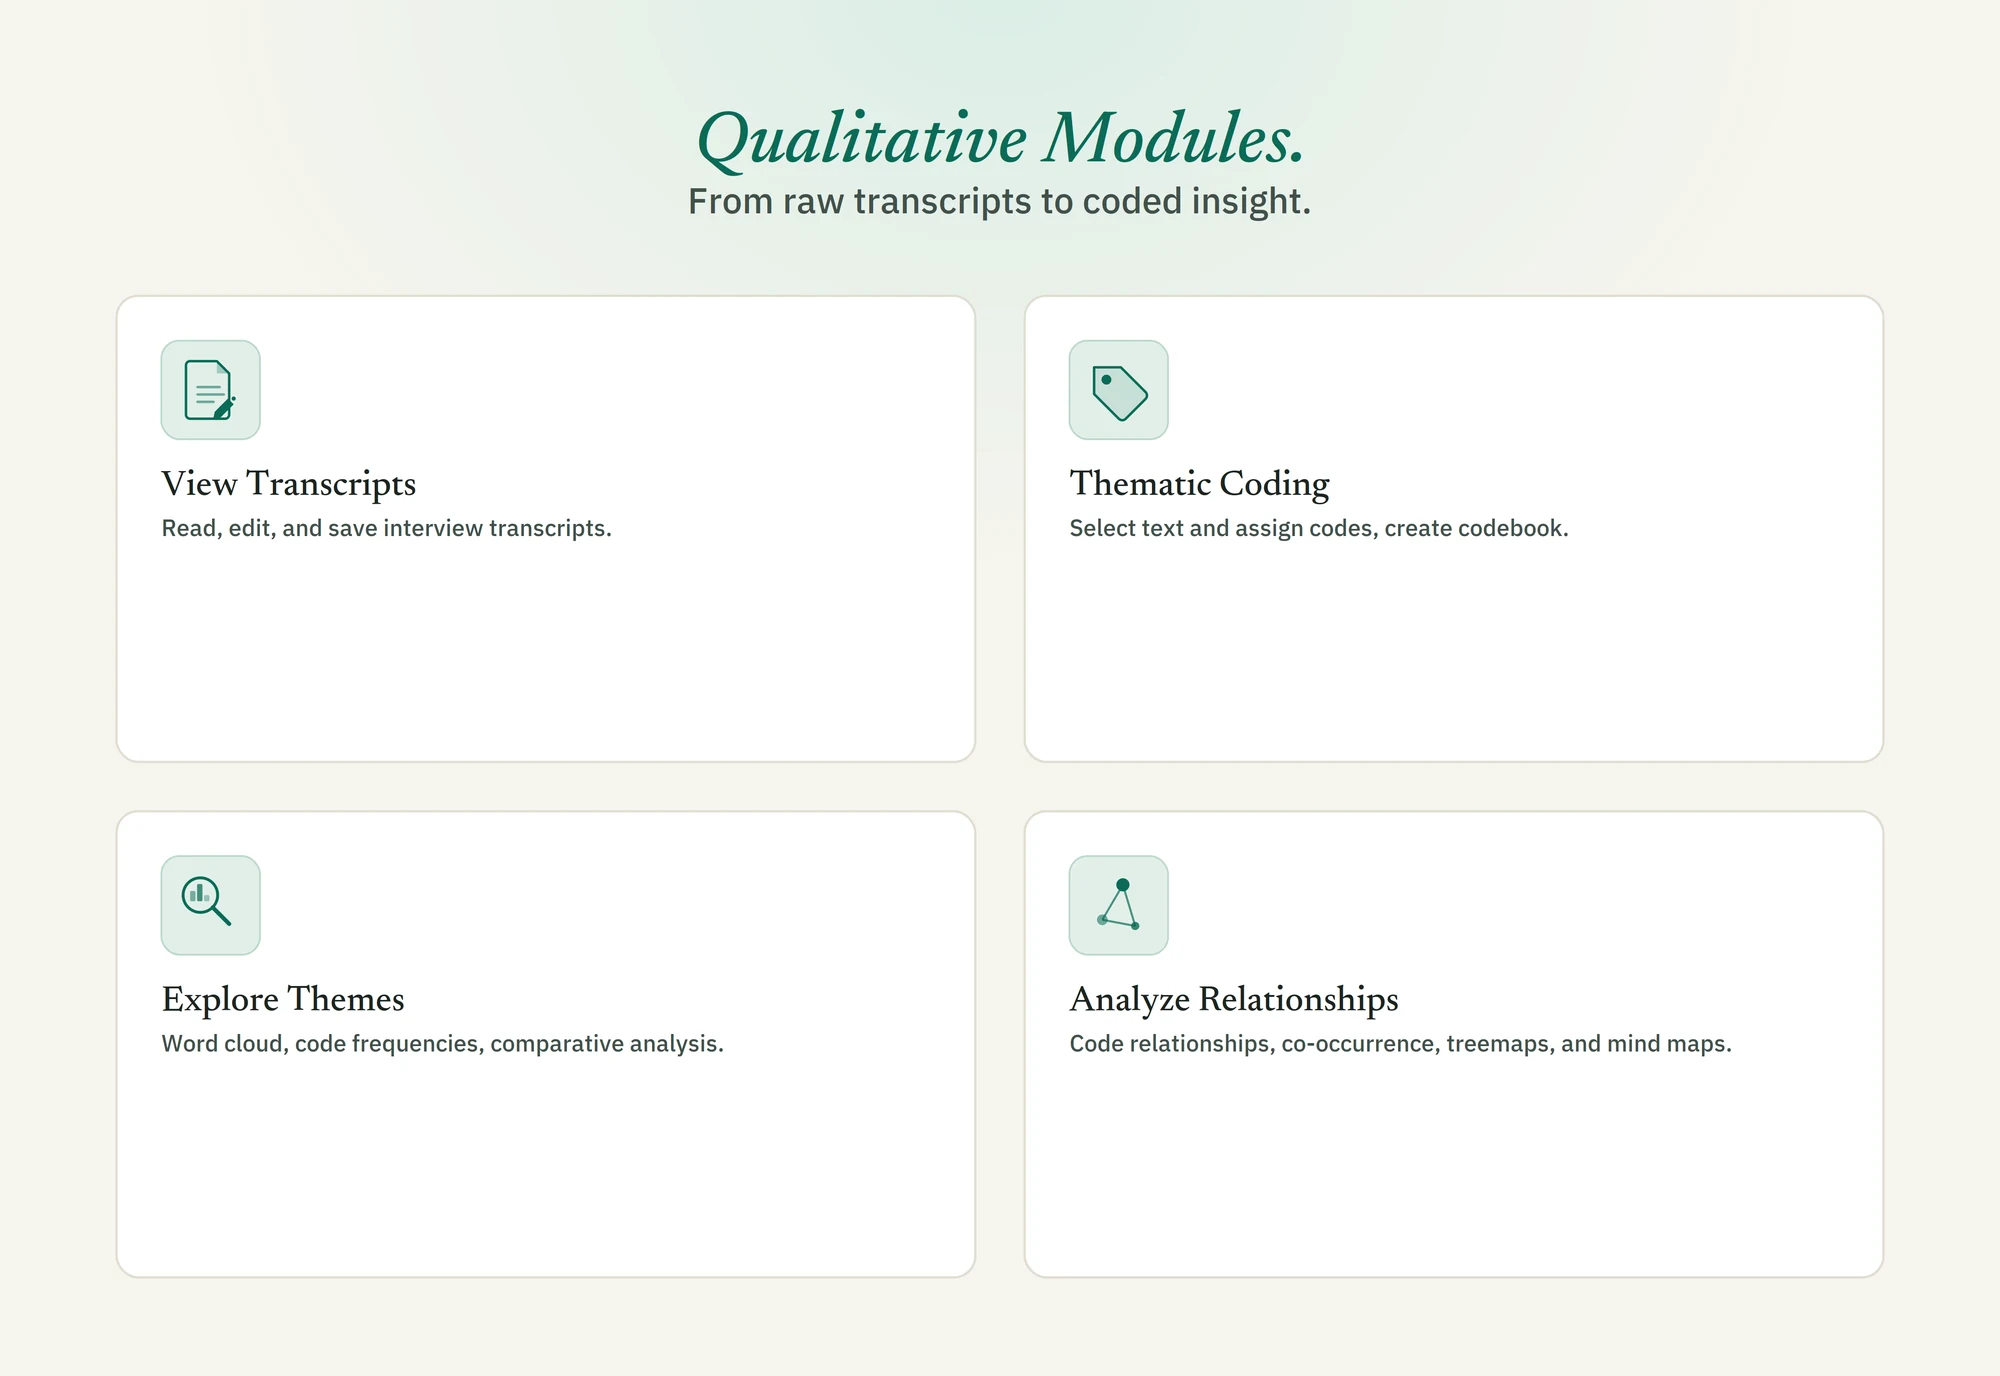
- Qualitative: transcript coding, theme exploration, and relationship analysis
- Sense Making ties both together into one coherent narrative
- Your judgment drives every step — AI enhances, never replaces
From chart to interactive dashboard
live and shareable.
Build a multi-chart dashboard and share it as a live link. Anyone can explore it in their browser with cross-filtering — click one chart and every other updates instantly.
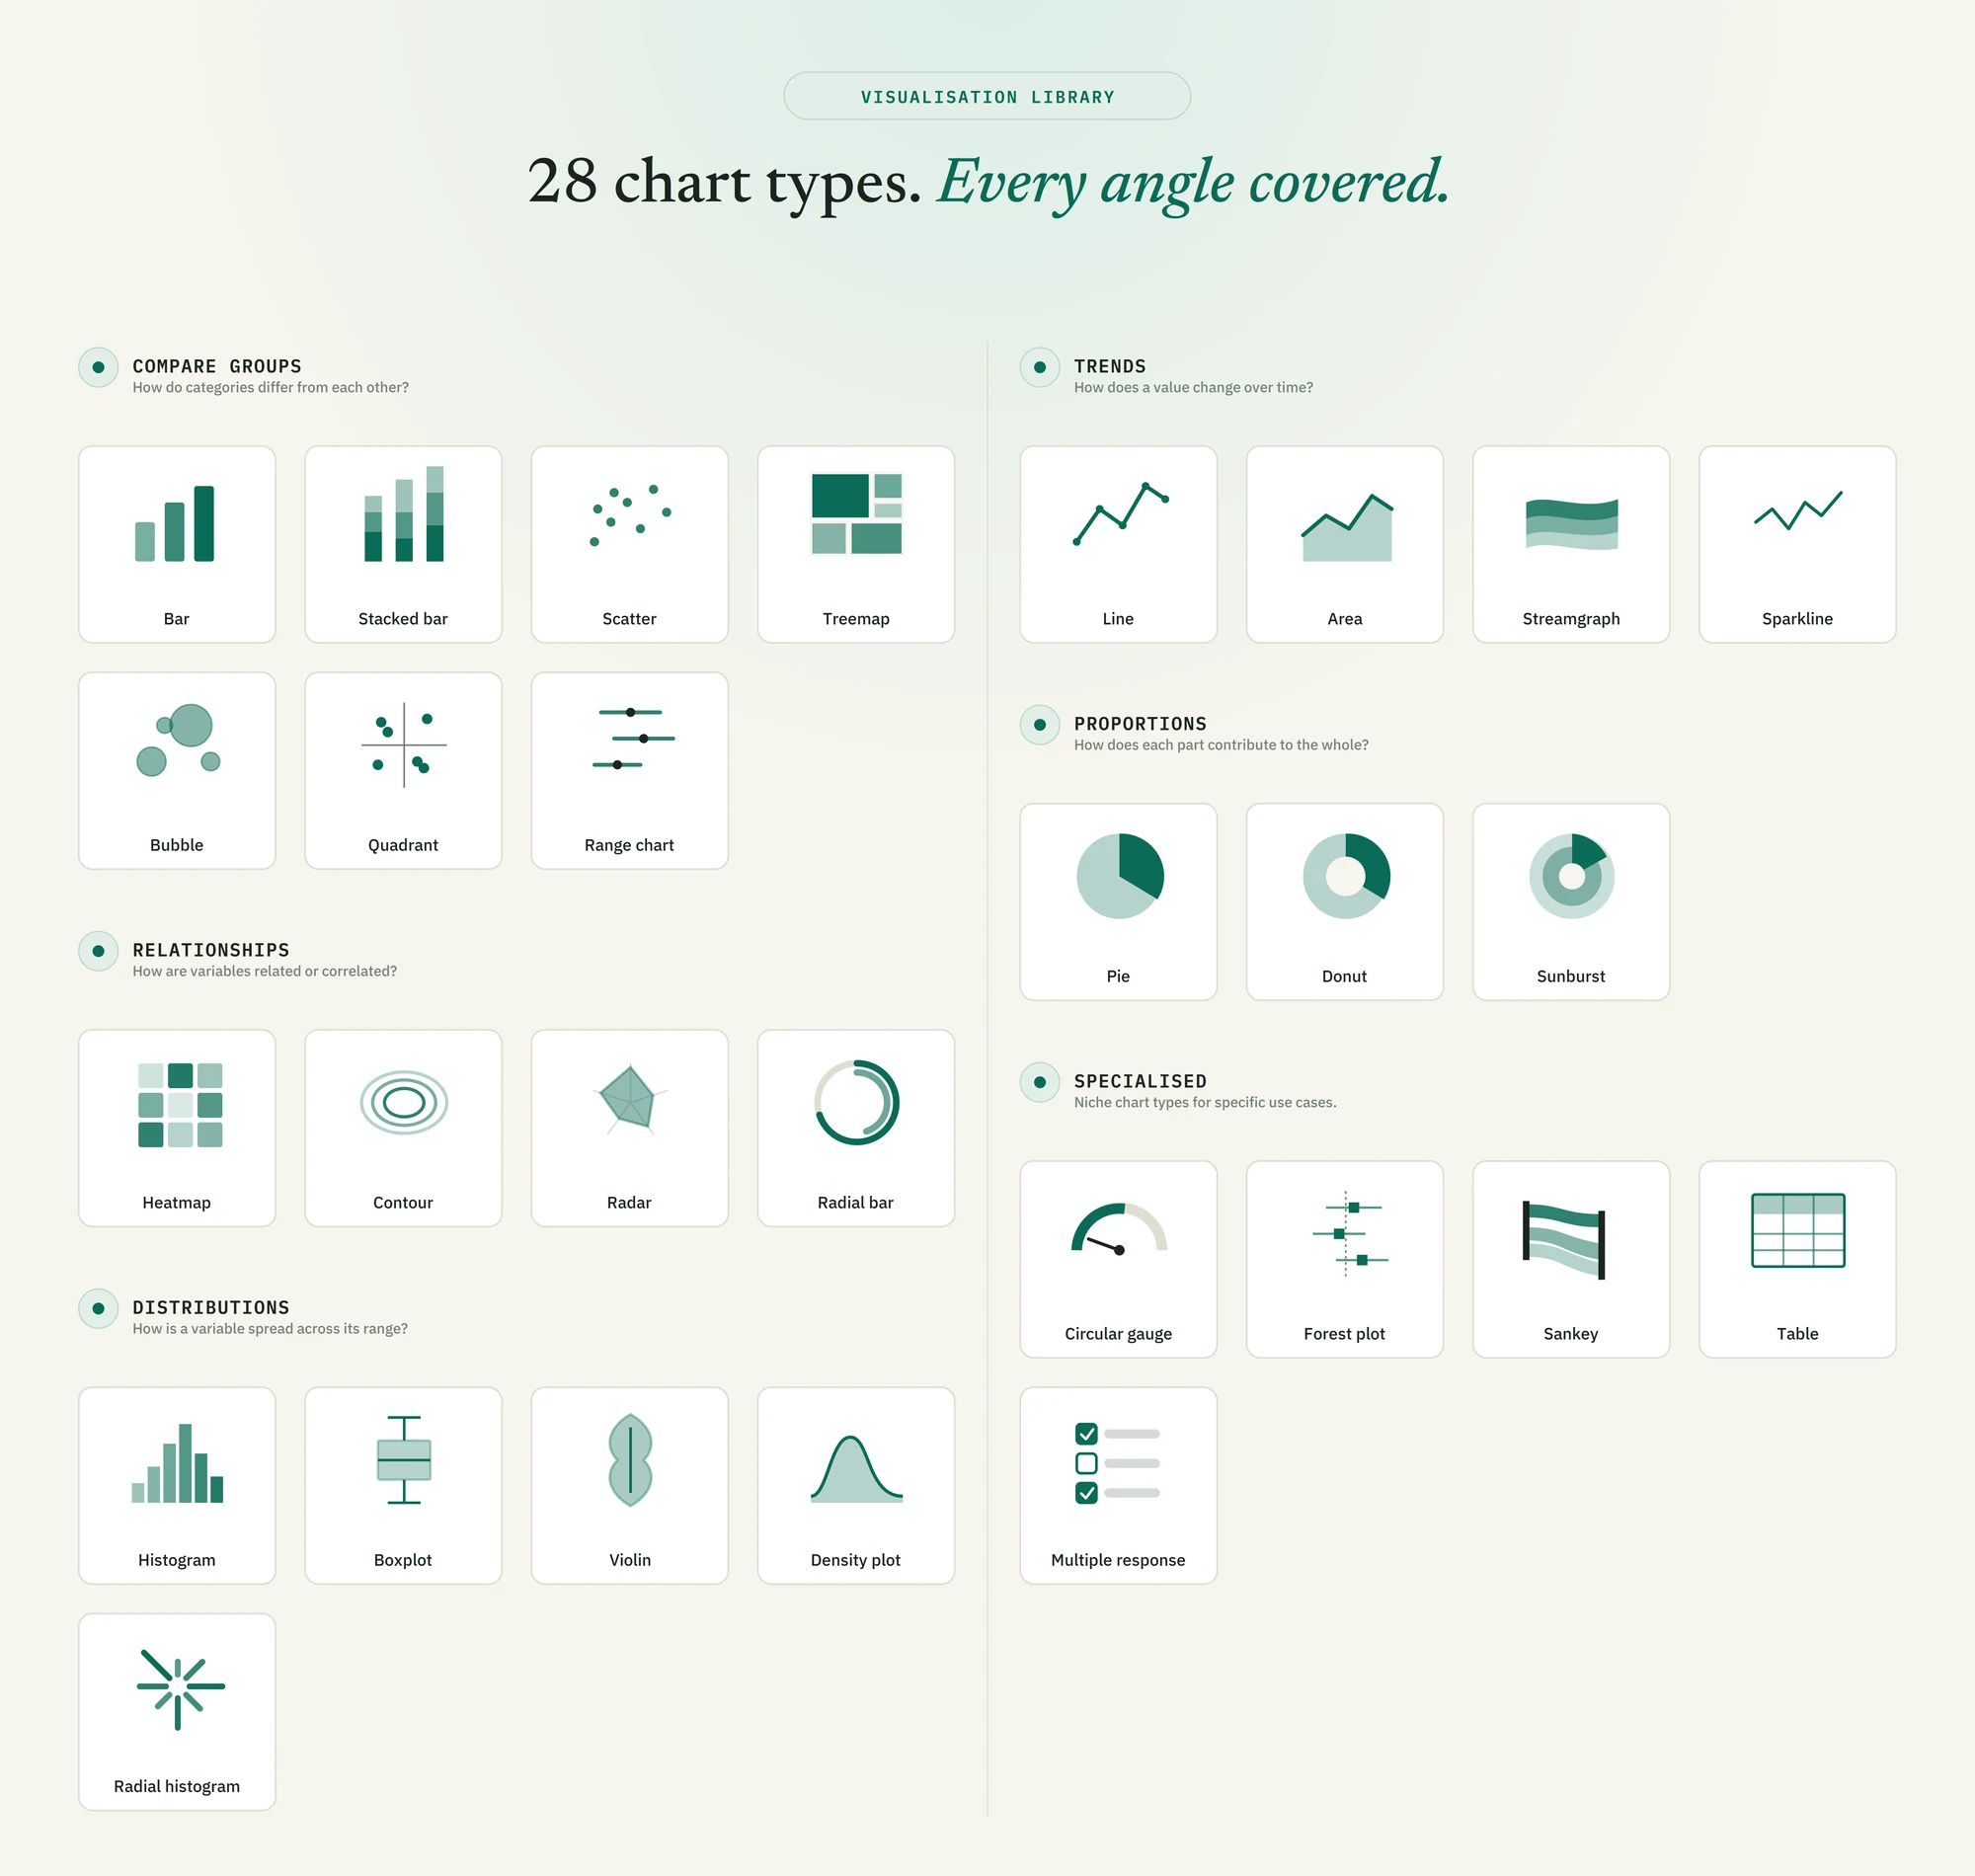
- 15+ chart types with full customisation
- Cross-filtering across all charts simultaneously
- AI-assisted interpretation per chart with AnalyZense
- Published as a live link — no login needed to view
From analysis to shared story.
The full journey.
AnalyZ takes you all the way — from raw data to a publishable narrative. Sense Making synthesizes your findings. Data Canvas turns them into a scrollable public story.
- Plain-English interpretation at every step
- Sense Making synthesizes findings into a narrative
- Data Canvas uses AnalyZense to generate a structured story from your findings, shareable as a public link
- The thinking and conclusions are always yours
Privacy is key. Data never leaves your browser.
Private by design.
Everything is processed inside your browser — nothing uploaded to our servers. AI features work from your summaries and charts, never your raw files.
- No data stored on our servers
- Raw files never sent to any AI model
- Safe for sensitive research, ethics boards, and IRB requirements
Real workflows. Real outcomes.
Three people. Three different contexts. One platform.
One platform. Everything it takes.
All the tools — in one place.
Mixed-methods analysis
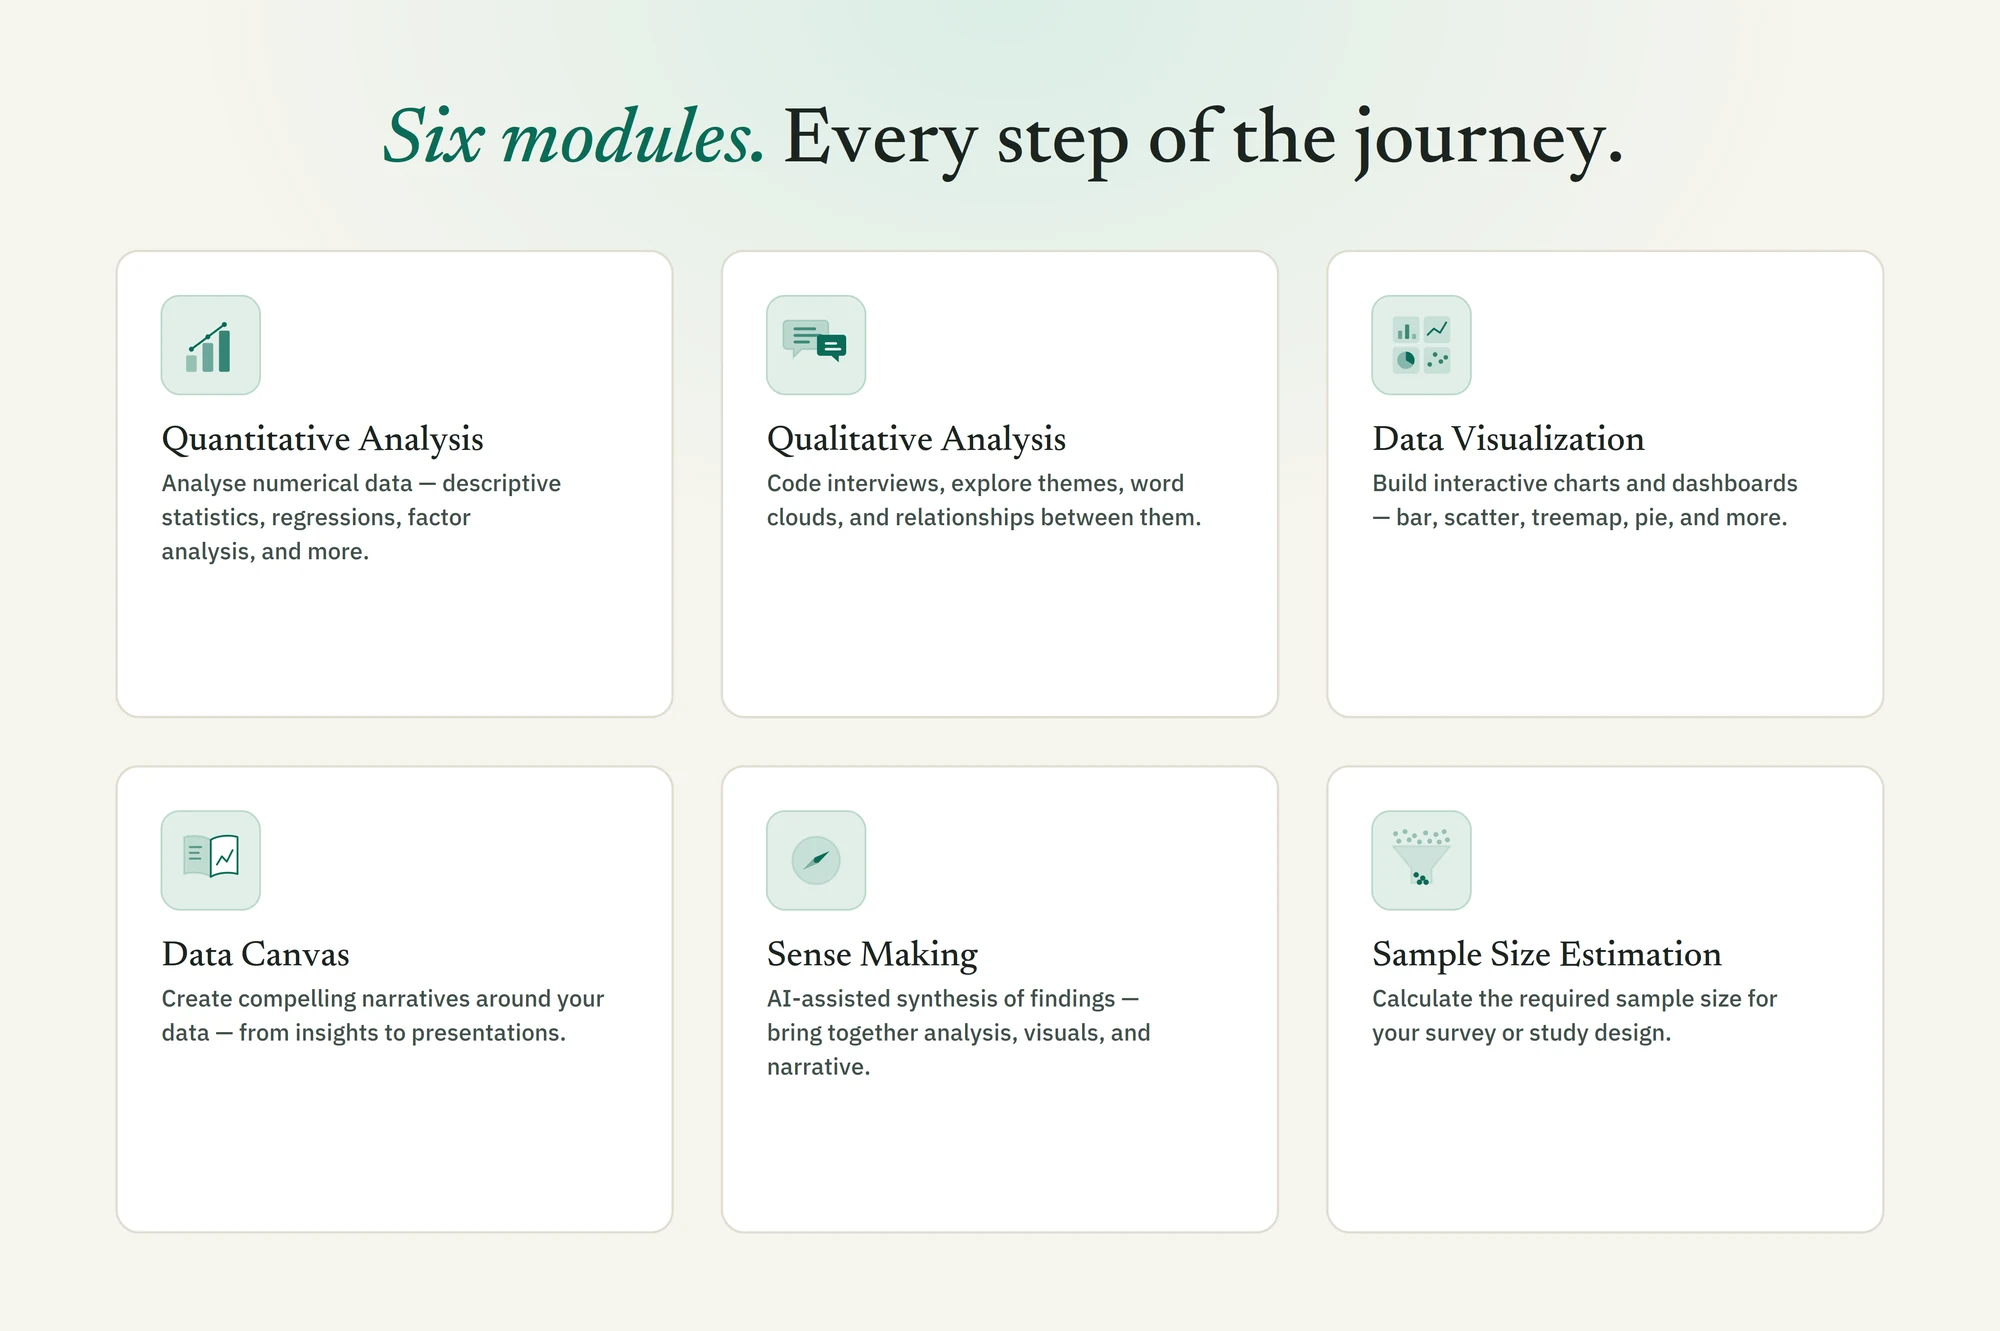
Analyze your survey data and your interview transcripts in the same session — no switching tools, no manual bridging. Quantitative and qualitative, side by side.
Learn more →Sense Making
When you're ready, Sense Making ties all your Analyzes into one coherent narrative. AI works from your results — tables, charts, and coded themes — never your raw data.
Learn more →Visualization & Dashboards
Build interactive charts and assemble them into a shareable dashboard. Cross-filtering lets anyone explore the data live. AI-assisted interpretation per chart.
Learn more →Data Canvas
Turn your findings into a scrollable public story — charts, infographics, and participant quotes with plain-language headlines. Publish as a link anyone can read.
Learn more →Data View
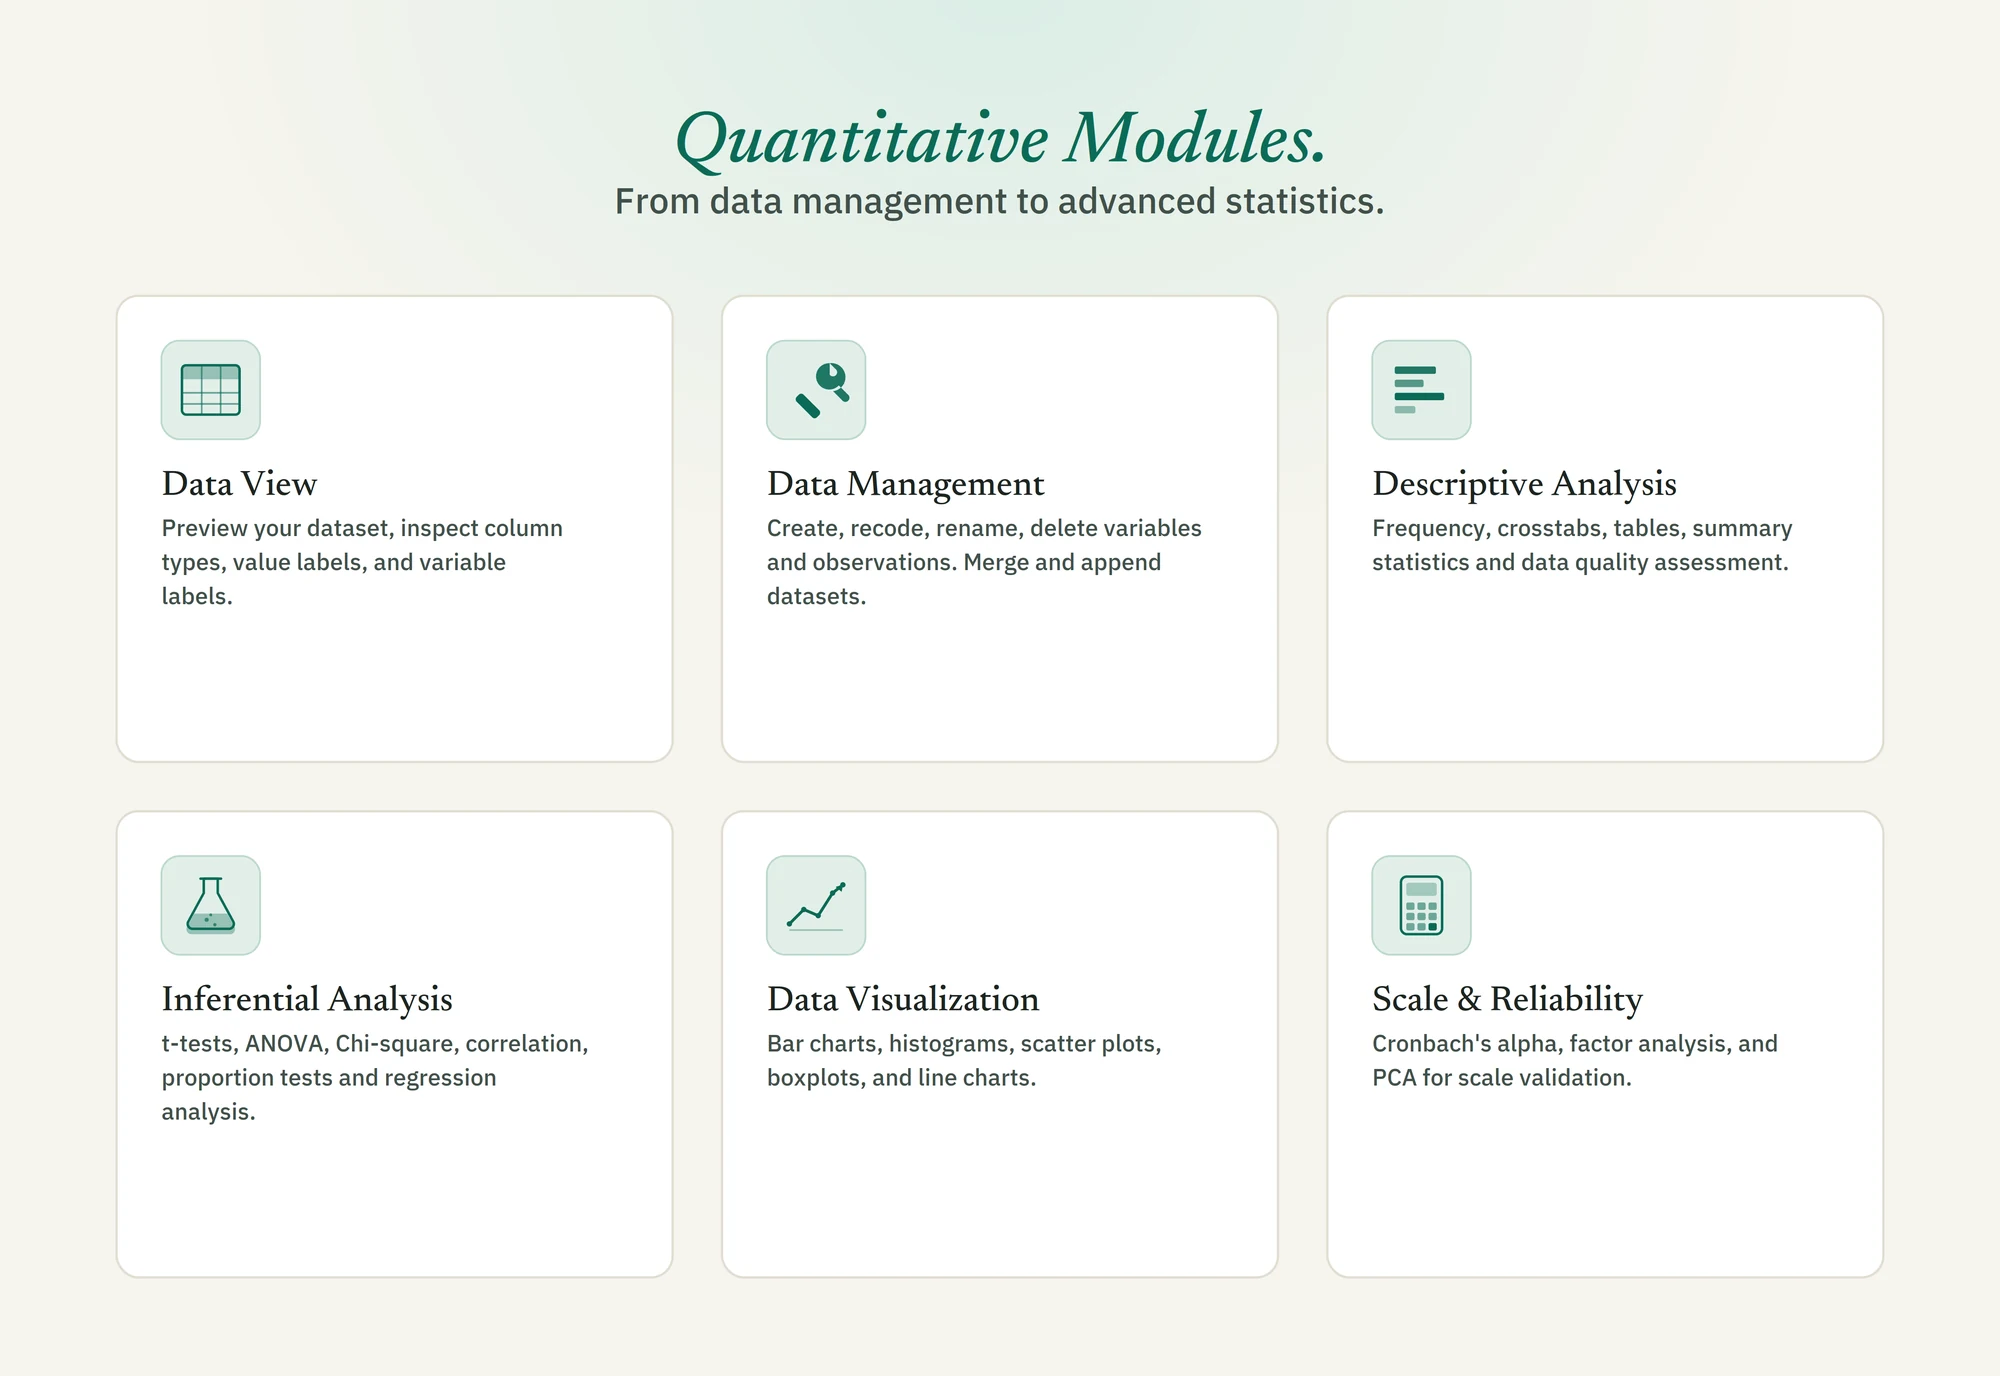
Inspect variable types, value labels, and missing values before analysis begins.
Data Management
Recode, rename, reshape, merge, and clean your dataset.
Descriptive Analysis
Frequency tables, crosstabs, summary statistics, and publication-ready tables.
Inferential Analysis
Statistical tests with effect sizes and plain-English reporting.
Scale & Reliability
Validate your measurement instruments with reliability analysis and factor analysis.
Sampling
Calculate sample sizes, run power analyses, and draw your sample directly from a sampling frame.
API Connectors
Connect directly to KoBo, ODK, REDCap, Google Sheets, and more.
Session Management
Save your entire session and restore it anytime.
Why not just use an AI chatbot?
Chatbots can explain. AnalyZ performs — producing real, verifiable results from your actual data that you can trust, export, and share immediately.
Simple, transparent pricing.
Start for free. Upgrade when you need more.
Need team or enterprise access? Contact us →
- ✔Full quantitative and qualitative analysis
- ✔Plain-English interpretation at every step
- ✔Export to Word, Excel, CSV, and PNG
- ✔Save and restore sessions
- ✔Save dashboards and canvases privately
- ✔Sense Making — 1 interpretation / month
- ✔Dashboard interpretation — 1 / month
- ✗Public sharing (dashboards & canvases)
- ✗Priority support
- ✔10 Sense Making interpretations / month
- ✔10 dashboard interpretations / month
- ✔5 Canvas story generations / month
- ✔15 Canvas slide refinements / month
- ✔Publish dashboards and canvases as public links
- ✔Priority support
- ✔50 Sense Making interpretations / month
- ✔50 dashboard interpretations / month
- ✔15 Canvas story generations / month
- ✔50 Canvas slide refinements / month
- ✔Early access to new features
Methods simplified. Application demonstrated.
Practical guides to research methods.
How to calculate sample size for a cross-sectional survey
Work out how many people to survey to estimate a prevalence or average at one point in time.
How to calculate sample size to detect a change in proportion
Work out the sample needed to detect a change in a percentage.
How to calculate sample size for a randomized controlled trial
Work out how many participants a randomized controlled trial needs in each arm.
How to calculate sample size to detect a change in a numeric outcome
Work out the sample needed to detect a change in a numeric average.
How to calculate sample size for a longitudinal study
Work out the sample needed for a study that follows the same people across several rounds.
How to calculate sample size for a case-control study
Work out how many cases and controls you need to compare exposure rates.
How to use LQAS to classify programme coverage
Classify whether programme coverage meets a threshold using a small sample per area.
Is your study big enough? A guide to statistical power
Judge whether a study is large enough to detect a real effect, and what statistical power means.
How to draw a sample from your sampling frame
Select units from your sampling frame using the design you have chosen.
Design effect and intraclass correlation coefficient (ICC) explained
Understand the design effect and ICC, and how to set them for cluster sampling.
How to calculate sample size for estimating incidence rate study
Work out the sample needed to estimate how often an event occurs per person-time.
How to calculate sample size to detect a change in an incidence rate
Work out the sample needed to compare two incidence rates measured over person-time.
How to audit your data before analysis
Check a dataset for missing values, outliers, duplicates and enumerator patterns before analysis.
How to explore data before analysis
Run the minimum checks on any new dataset before formal analysis begins.
How to perform a Chi-Square test
Cross-tabulate two categorical variables and test whether they are related.
How to generate a publication-ready table
Build a formatted multi-variable table, broken down by a grouping variable, for reports and papers.
What is inferential analysis and how do you choose the right test?
Understand how inferential analysis works and match your question and data to the right test.
How to tell if the difference between two groups is real
Compare the average of a numeric outcome between two separate groups.
How to tell if your average differs from a target value
Test whether the average in your sample differs from a known or expected value.
How to tell if scores changed between two measurements
Compare two measurements taken on the same people, such as before and after.
How to tell if three or more groups differ
Test whether the average of a numeric outcome differs across three or more groups.
How to tell if two factors, and their combination, affect an outcome
Test how two categorical factors, separately and together, relate to a numeric outcome.
How to compare an outcome across repeated measurements or conditions
Test whether an average changes across three or more measurements on the same people.
How to measure how strongly two variables are related
Measure how strongly two variables move together using Pearson or Spearman correlation.
How to compare percentages with a z-test for proportions
Test whether a percentage differs from a target, or whether two percentages differ.
What are non-parametric tests? When to use them and which to choose
Choose the right rank-based test and know when to use one.
Friedman test: compare repeated measurements when your sample is small or your data is ordinal
Compare three or more repeated measurements on the same people using ranks.
Kruskal-Wallis test: compare three or more groups when your sample is small or your data is ordinal
Compare three or more independent groups using ranks when data is skewed or ordinal.
Mann-Whitney U test: compare two groups when your sample is small or your data is ordinal
Compare two independent groups using ranks when data is skewed, ordinal or small.
Wilcoxon signed-rank test: compare two paired measurements when your sample is small or your data is ordinal
Compare two paired measurements using ranks when data is skewed, ordinal or small.
What is linear regression? Theory, calculation and application
Estimate how a numeric outcome changes with one or more predictors.
What is hierarchical regression? Theory, calculation and application
Add predictors in planned blocks and see how much each block improves the model.
What is logistic regression? Theory, calculation and application
Model the chance of a yes or no outcome from one or more predictors.
What is multinomial regression? Theory, calculation and application
Model outcomes with several unordered categories.
How to analyze clustered or hierarchical data
Analyse data in which people are nested in groups such as classrooms or clinics.
What is negative binomial regression? Theory, calculation and application
Model count outcomes whose variation is larger than their average.
What is Poisson regression? Theory, calculation and application
Model outcomes that are counts, such as clinic visits or incidents.
What is ordinal regression? Theory, calculation and application
Model outcomes with a natural order, such as satisfaction ratings.
What is probit regression? Theory, calculation and application
Model yes or no outcomes with a close relative of logistic regression.
How to test the reliability of a questionnaire scale
Check that the items of a questionnaire scale give consistent answers.
Principal Component Analysis: How to reduce many survey questions to a few summary scores
Condense a set of related variables into a few components.
Exploratory Factor Analysis: How to find out which survey questions belong together
Find the dimensions behind a set of questionnaire items.
What is qualitative data analysis?
Understand the main approaches to qualitative analysis and how to establish rigour.
How to develop thematic codes for qualitative research
Build a codebook, assign codes to text and review the coded segments.
How to calculate inter-rater reliability in qualitative research
Measure how closely two coders agree using Cohen's Kappa.
How to know if you have collected enough qualitative data
Judge when you have collected enough interviews to stop.
How to bring out group differences in qualitative research
Compare how themes differ across participant groups.
Inductive vs deductive coding in qualitative research
Decide whether your codes should come from the data or from a framework you bring to it.
How to uncover relationships between themes in qualitative data
Look at how themes connect through co-occurrence, networks, clusters and code sequences.
How to create personas in qualitative research
Turn analytical types from your qualitative data into clear participant profiles.
How to interpret your analysis with sense making
Organise analyses into projects, add context and run a synthesis that interprets your results together.
How to write up mixed-methods findings for different audiences
Choose a plain language, academic, executive summary or narrative style for your findings.
How to tell a story using your data
Arrange charts, tables and text on a canvas to present your findings as a story.
The AnalyZ Solutions privacy model
See how your data is processed inside your own browser, and what is and is not stored.
How to connect KoBo, ODK, REDCap or Google Sheets to AnalyZ Solutions
Pull survey data straight from KoBo, ODK Central, REDCap, Google Sheets or any JSON or CSV source.
How to save your work and pick it up again later
Keep your data, labels, codes and history between visits, and restore them when you return.
How AI is used in AnalyZ Solutions, and what it never sees
See where AI appears in the platform, what it receives and what it never does.
Why you should not rely on AI to analyze your data
Why AI should not run your statistics or code your interviews, and where it does help.
Questions? We've got answers.
Can't find what you're looking for? Email support@analyz.solutions or check our full user guide.