How to know if you have collected enough qualitative data
One of the most common questions in qualitative research: how many interviews are enough? This guide explains thematic saturation as both a concept and a practical tool, when to assess it, what to do if you have not reached it, and how to find it in AnalyZ Solutions.
01The problem: how much qualitative data is enough?
In quantitative research, sample size is determined by a power calculation: a formula that specifies how many participants you need to detect an effect of a given size at a given confidence level. Qualitative research has no equivalent formula, and the absence of one leaves many researchers uncertain about when they have enough data.
The answer that has become standard in qualitative methodology is thematic saturation: you have enough data when new interviews stop telling you anything new. More precisely, when a new transcript produces no new codes that were not already present in the previously coded data, the thematic structure of the dataset is considered stable.
Consider an example. A researcher is studying the experience of first-generation university students. After five interviews, codes like "Financial pressure", "Imposter syndrome", "Lack of family understanding", and "Difficulty navigating bureaucracy" have all appeared. By the eighth interview, a new code "Absence of role models" emerges. By the twelfth interview, no new codes have appeared in the preceding four. At that point, the researcher can reasonably conclude that further interviews are unlikely to reveal themes that are not already represented in the data.
These two terms are sometimes used interchangeably but they refer to different standards. Thematic saturation simply asks whether new codes are still emerging from the data: it is a pragmatic criterion suited to most applied qualitative research and evaluation. Theoretical saturation is a more demanding concept from grounded theory: it refers to the point at which new data no longer contributes to the development of a theory, meaning the categories are fully developed, their properties and dimensions are understood, and the relationships between categories are clear. For programme evaluations and most applied studies, thematic saturation is the appropriate criterion. Theoretical saturation is relevant when the aim is to build or formally extend a grounded theory.
02What thematic saturation means and does not mean
Saturation is a claim about the codebook, not about the population. Reaching saturation means the thematic structure of your dataset has stabilised: further data collection is unlikely to change the overall picture. It does not mean the data has been exhausted, or that no further quotes on these themes could be found. For the wider process, see what qualitative data analysis involves.
It also does not mean that your sample is representative of any broader population. Qualitative samples are purposive, not random. A study that reaches saturation at twelve interviews among urban women cannot claim to represent the experience of all women. What it can claim is that the thematic structure identified in these twelve interviews is stable and well-evidenced within this group.
Saturation is also relative to the coding framework. A study using twenty broad codes will reach saturation faster than a study using fifty fine-grained codes applied to the same data. This is not a flaw in the concept; it is a reason to be transparent about the level of abstraction at which saturation was assessed. If several people code the data, inter-rater reliability shows whether they apply the codes consistently.
03When to test for saturation
The most useful time to assess saturation is during data collection, not after it ends. When saturation is assessed only retrospectively, it functions as a post-hoc justification of a sample size that was already fixed. When assessed prospectively, it becomes a genuine decision tool: it tells you whether to continue collecting data or whether you have enough.
The recommended practice is a rolling assessment. After coding each new transcript, check whether any new codes were introduced. In AnalyZ Solutions, this means opening the Saturation view in Explore Themes after coding each interview. The chart updates automatically. The check takes a few minutes and gives you a continuously updated picture of where the codebook stands.
A practical approach used in many funded evaluations: agree with commissioners at the outset that data collection will continue until saturation is reached, with a minimum number of interviews (say, eight) and a maximum (say, twenty). When three consecutive interviews produce no new codes, conclude data collection. This gives saturation a concrete operational definition that can be reported transparently and agreed in advance with the funder.
When data collection has already been completed before analysis begins, which is common in research where fieldwork and analysis happen sequentially, saturation assessment is still worthwhile. It confirms whether the completed sample was sufficient and provides the language needed to justify the sample size in the methods section. If saturation was not reached, it identifies which themes were still emerging and supports an honest discussion of what further data might have contributed.
One practical requirement: the saturation curve only makes sense once coding has been completed on at least three or four transcripts. Running it after a single transcript will show only a rising bar with no evidence of flattening, which is uninformative. The curve becomes meaningful as the pattern of new code introduction across multiple transcripts becomes visible.
04What to do if data collection is complete but saturation was not reached
This is a common situation, particularly in evaluation research where data collection timelines are fixed by field schedules rather than by analytical need. If you have completed data collection and your saturation curve shows new codes still appearing in the final transcripts, several options are available.
Review whether late-appearing codes are genuinely new themes. Sometimes codes added late in the analysis are narrow variants of themes already present, rather than genuinely new ideas. If a late code "Difficulty obtaining childcare for clinic visits" is a specific instance of the already-present code "Practical barriers to access", it may not represent a new theme requiring additional data. Merge it with the broader code and reassess the curve.
Acknowledge the limitation explicitly. If late codes are genuinely new themes and data collection cannot be extended, report this as a limitation. Write something like: "The saturation curve suggests that thematic saturation may not have been fully reached in this study. Two new codes emerged in the final two transcripts, suggesting that additional interviews might have revealed further themes. Findings should be interpreted in light of this limitation."
Collect targeted supplementary data. If the late-emerging codes relate to a specific subgroup or topic, and if resources permit, a small number of additional targeted interviews with participants who might speak to those themes can address the gap. Even two or three additional interviews focused on the under-explored theme can meaningfully strengthen the analysis.
Triangulate with other sources. If the late-emerging themes appear in secondary sources (programme documents, field notes, earlier evaluations), that triangulated evidence can partially compensate for the absence of full saturation in the primary data.
05A worked example
A researcher is studying barriers to girls' secondary school enrolment in a rural district. She interviews participants one at a time and codes each transcript before moving to the next. Here is what her codebook looks like after each interview:
| Interview | New codes introduced | New codes (n) | Cumulative codes |
|---|---|---|---|
| IDI 01 | Distance to school, Cost of fees, Safety on the road, Domestic work burden, Low parental education | 5 | 5 |
| IDI 02 | Early marriage pressure, Lack of female teachers, Poor sanitation facilities | 3 | 8 |
| IDI 03 | Peer dropout influence, Pregnancy and dropout | 2 | 10 |
| IDI 04 | Teacher absenteeism | 1 | 11 |
| IDI 05 | None | 0 | 11 |
| IDI 06 | None | 0 | 11 |
| IDI 07 | None | 0 | 11 |
The saturation curve for this study would show five bars for IDI 01, three for IDI 02, two for IDI 03, one for IDI 04, and then zero for IDIs 05, 06, and 07. The cumulative line rises steeply through the first four interviews and then flattens at eleven codes. Three consecutive zero-bar interviews confirm that the codebook is stable.
The researcher can now report: "Thematic saturation was reached after the fourth interview. No new codes were introduced in interviews five through seven, confirming that the thematic structure of the data was stable at eleven codes across seven interviews."
What the saturation curve looks like
The chart below illustrates the pattern described above. The bars show new codes per interview; the line shows the cumulative codebook size.
Figure 1. Saturation curve for a study of barriers to girls' secondary school enrolment (7 interviews, 11 codes). The cumulative line flattens after IDI 04, with three consecutive interviews introducing no new codes.
06How to find saturation in AnalyZ Solutions
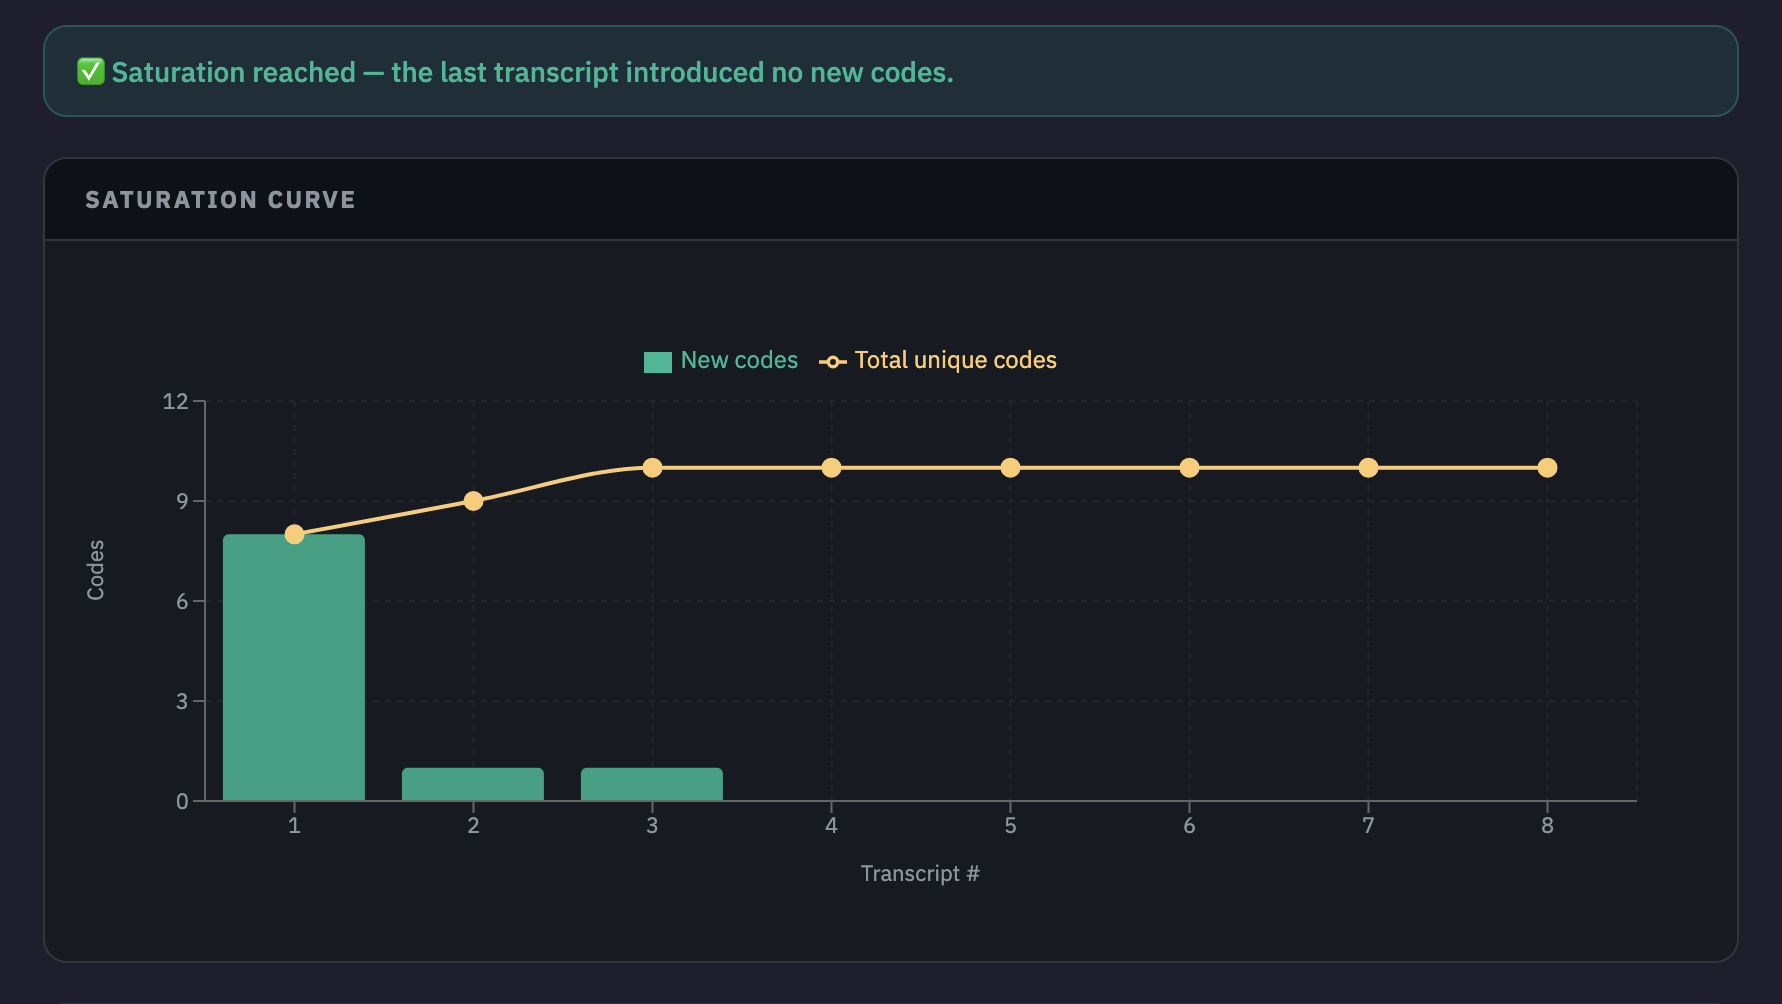
Open Explore Themes from the qualitative home page and select Saturation. The chart shows two things for each transcript in the order it was coded.
Bars (new codes per transcript): how many codes were applied for the first time when coding this transcript. A tall bar means many new themes emerged. A bar at zero means no new themes were found.
Line (cumulative unique codes): the total number of distinct codes in use after coding each transcript. A rising line means the codebook is still growing. A flat line means it has stabilised.
A few practical points before running the analysis:
- Code at least three or four transcripts first. The saturation curve requires multiple transcripts to be meaningful. After a single coded transcript, the chart will show only a tall opening bar with nothing to compare it against. After two transcripts, you may see a drop but cannot yet tell whether the codebook is stabilising. From the third transcript onwards, a pattern begins to emerge.
- Code transcripts one at a time and check the curve after each. If you code all transcripts before opening the Saturation view, you lose the ability to use it as a live decision tool. The value of rolling assessment is that it tells you when to stop before the next interview is scheduled.
- The curve reflects the order in which you coded, not the order in which interviews were conducted. If you have transcripts from different participant groups, interleave them when coding. Coding one group's transcripts first will produce a curve that appears to saturate early within that group, then rises again when you begin coding the second group.
- A code must appear in at least two transcripts to confirm it is a recurring theme rather than a one-off observation. A code that appears only once, in the very last transcript coded, may indicate an emerging theme that warrants further data collection, or it may reflect a single participant's unusual experience. Read the segments before deciding.
Reading common patterns
Early peak, then flat: most new codes appear in the first two or three transcripts, and the curve flattens thereafter. This is the classic saturation pattern in a relatively homogeneous sample. It suggests themes were captured early and subsequent transcripts confirmed rather than extended them.
Gradual growth, then flat: new codes continue to emerge across several transcripts before stabilising. Common in more heterogeneous samples or studies with broader research questions. Saturation is still reached, but later, and the analysis is richer for it.
Still rising at the end: new codes appear in the final transcripts. Saturation has not been reached. This indicates either that the sample needs to be expanded, or that the codebook is too fine-grained and some codes should be merged into broader themes.
07How to report saturation in a research report
Saturation belongs in the Methods section of a report or paper, not in the findings. A typical sentence might read: "Thematic saturation was assessed by tracking new codes introduced with each additional transcript. New codes emerged across the first nine interviews; no new codes were introduced in interviews ten through fourteen, indicating that the thematic structure of the data was stable at fourteen interviews."
If saturation was assessed prospectively and used to inform the decision to stop data collection, say so. This demonstrates that the sample size was principled rather than arbitrary.
08Limitations of saturation as a concept
Saturation is a useful concept but it has real limitations that researchers should acknowledge.
It depends on the coding framework. Saturation is relative to the codebook you are using. This is a reason to be transparent about the level of abstraction at which saturation was assessed, not a reason to dismiss the concept.
It does not guarantee completeness. Reaching saturation means no new themes appeared in the data you collected. It does not mean no new themes exist in the population. Sampling strategy and participant selection still matter.
It can be reached prematurely with a homogeneous sample. If all participants share the same background, saturation will be reached quickly but findings will not transfer to more diverse populations. Purposive sampling that maximises variation is important for saturation to be meaningful.
How many interviews typically produce saturation?
Can I claim saturation if I only have six interviews?
Should saturation be assessed at the code level or the theme level?
Does saturation apply to focus group discussions as well as interviews?
Should I include the saturation curve in my published paper?
How do I know whether a new code introduced late in analysis is genuinely new or just a variant of an existing code?
Does the order in which I code transcripts affect saturation?
Can saturation be reached too quickly?
My funder requires a fixed sample size. How do I handle saturation reporting?
Check saturation in your study
Examine the saturation curve in AnalyZ Solutions. Free to sign up, free to analyze.
Get started