Plan
Work out how many people you need to survey, then draw your sample from the sampling frame.
Estimate the sample size and check power across nine study designs.
Draw the sample directly from your sampling frame.
Upload
Bring in your survey data and your transcripts, connect a survey platform, or pick up a saved session where you left off.
Excel, CSV, SPSS, Stata and JSON files.
Word, PDF and plain text files.
Connect directly to KoBoToolbox, ODK Central, REDCap or a published Google Sheet.
Restore a saved session file with your data, labels, codes and history.
Organize
Check your data, then clean and shape it before it reaches an analysis. Prepare your transcripts for coding.
Duplicates, range checks, digit preference and enumerator patterns, with a flag for each enumerator.
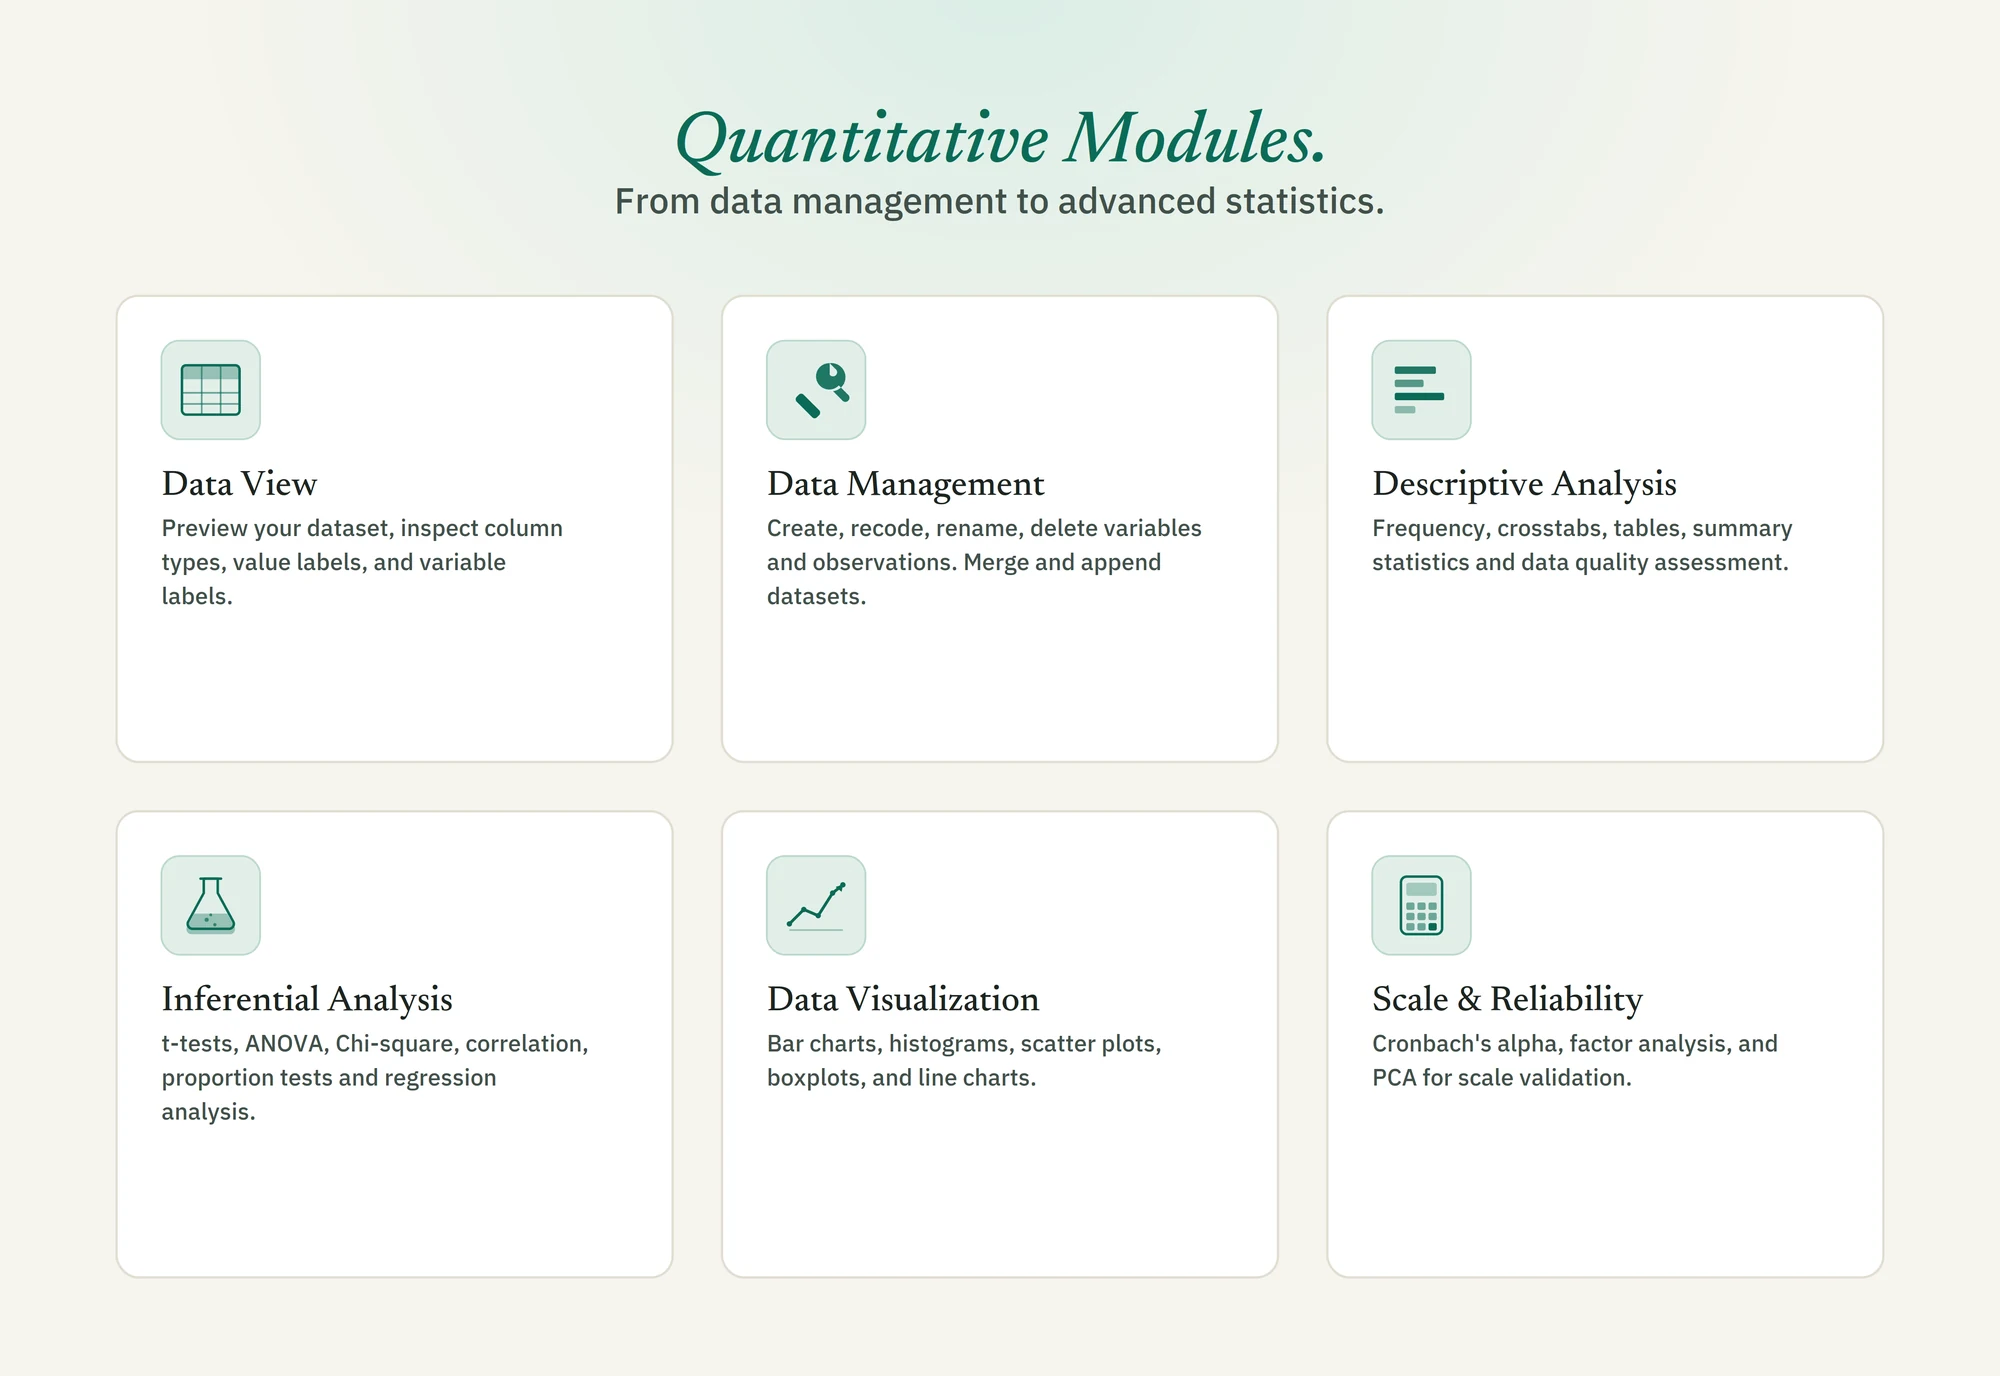
Recode, rename, merge, append and run many other operations on quantitative data.
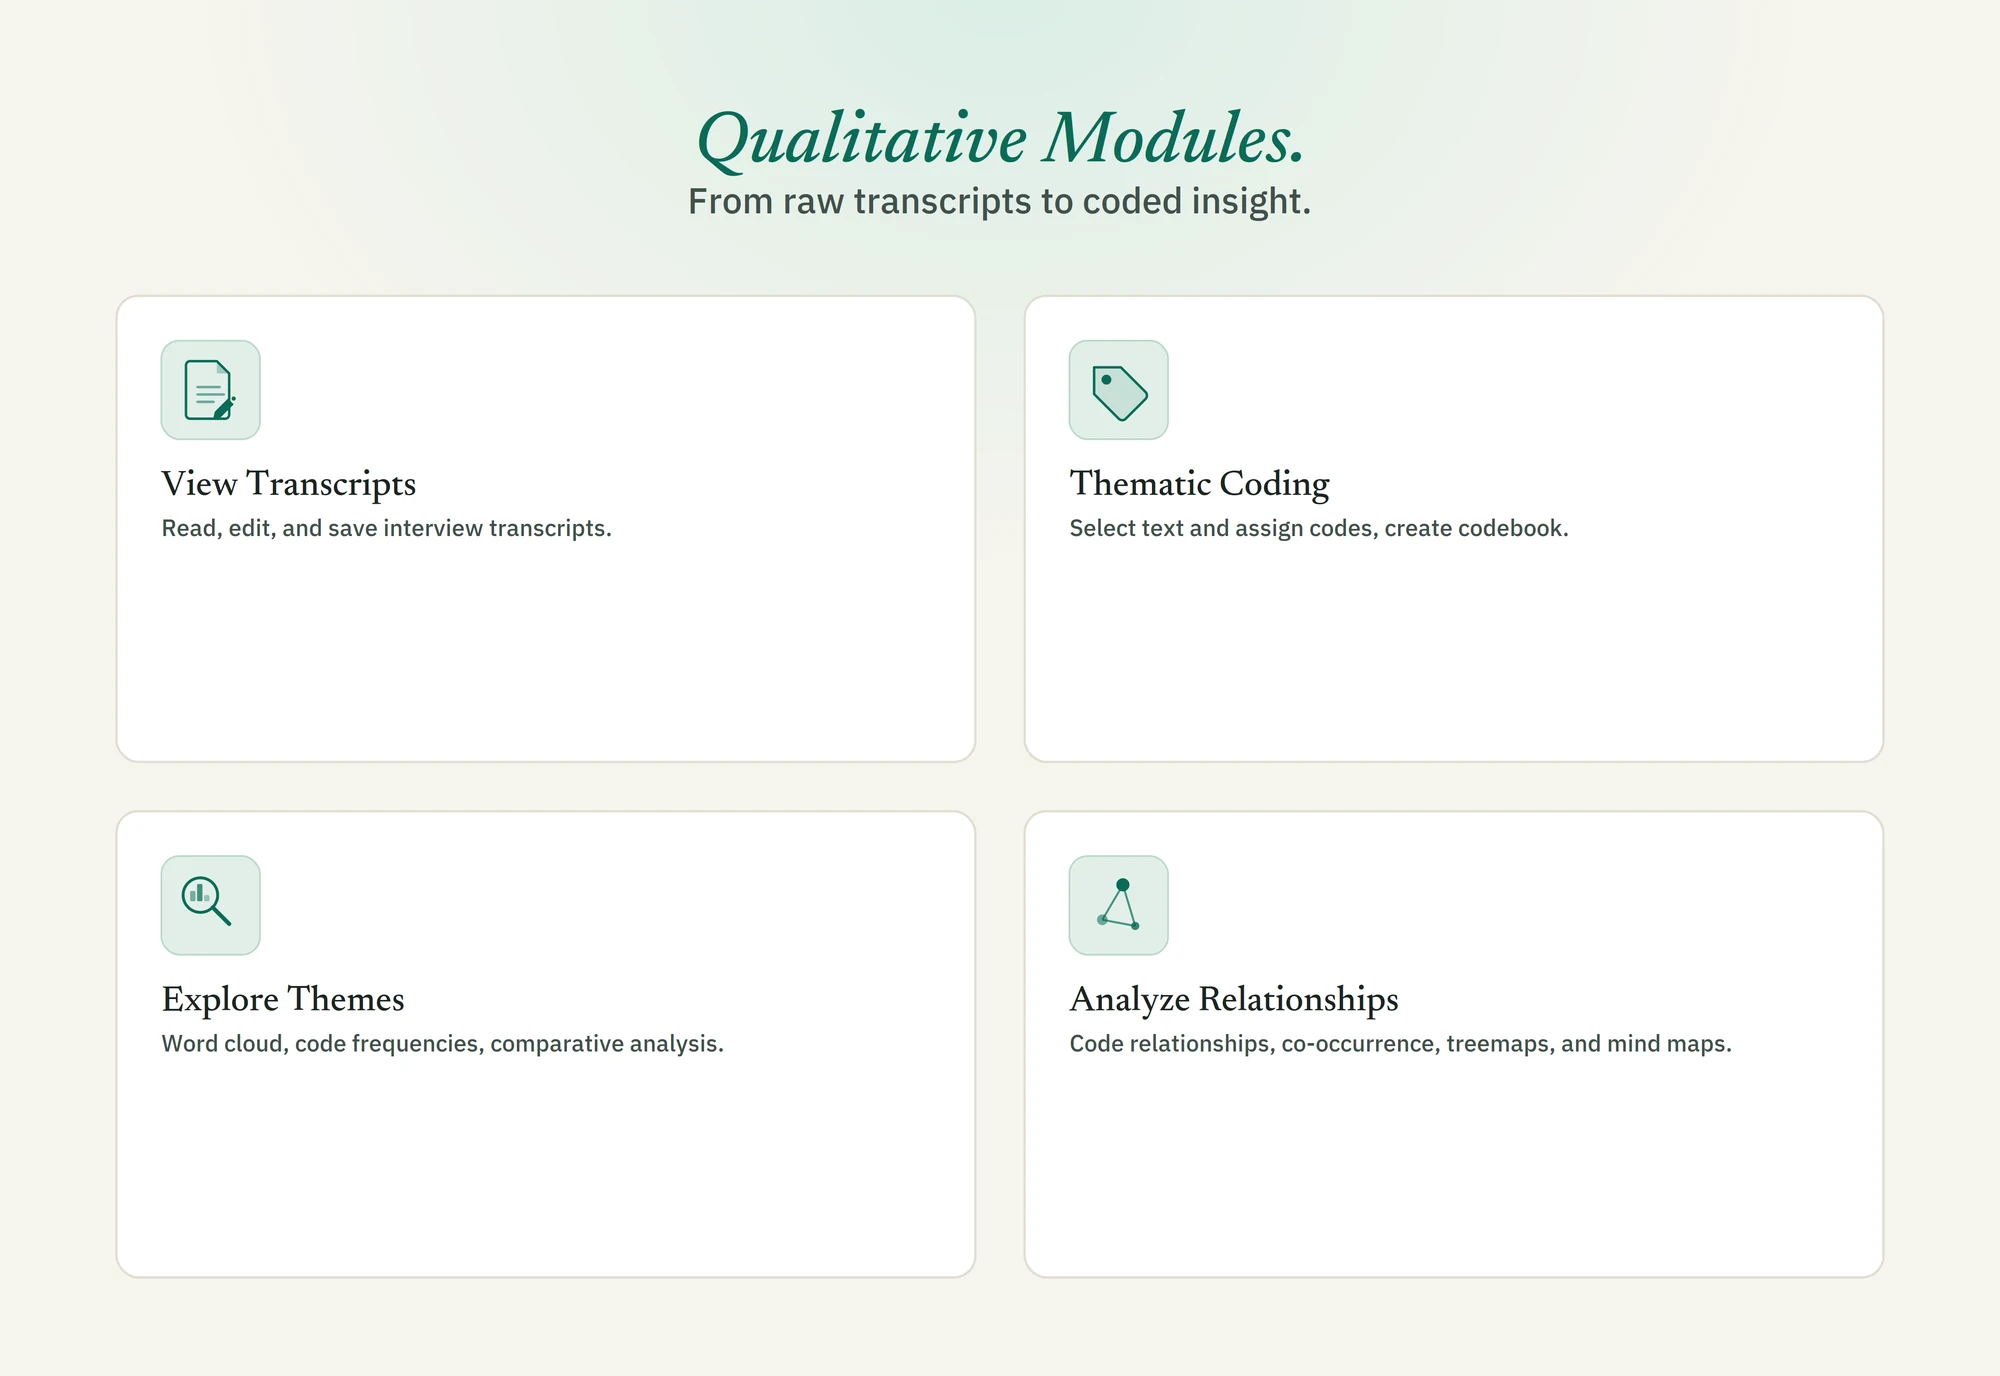
Tag, read, edit and search your qualitative transcripts.
Data View has a right-click menu with quick operations for any column.
Analyze
Run statistical analysis on your numbers and thematic coding on your interviews, in the same workspace, then bring the two together.
Frequencies, cross-tabs, summary statistics and a formatted summary table ready for reports and papers.
23 tests and models, from t-tests to multilevel regression.
Propensity score matching, difference-in-differences, regression discontinuity and instrumental variables.
Cronbach's Alpha, exploratory factor analysis and PCA.
Confirmatory factor analysis, path models and mediation.
A codebook with memos, highlight-to-code, and Boolean queries across coded segments.
Saturation, comparison across groups, and which themes travel together.
Network and mind maps, clusters, sequences, QCA and personas.
Compare the agreement statistics of two individual coders using Cohen's Kappa.
Interpret
Understand what the results mean, then turn them into something people can explore or read.
Tests, models, tables and charts come with a written interpretation you can adapt for your report.
Gather results and participant quotes in one project, and get a synthesis that draws on both. Choose plain language, academic, executive summary or narrative style, ask follow-up questions, and export to Word.
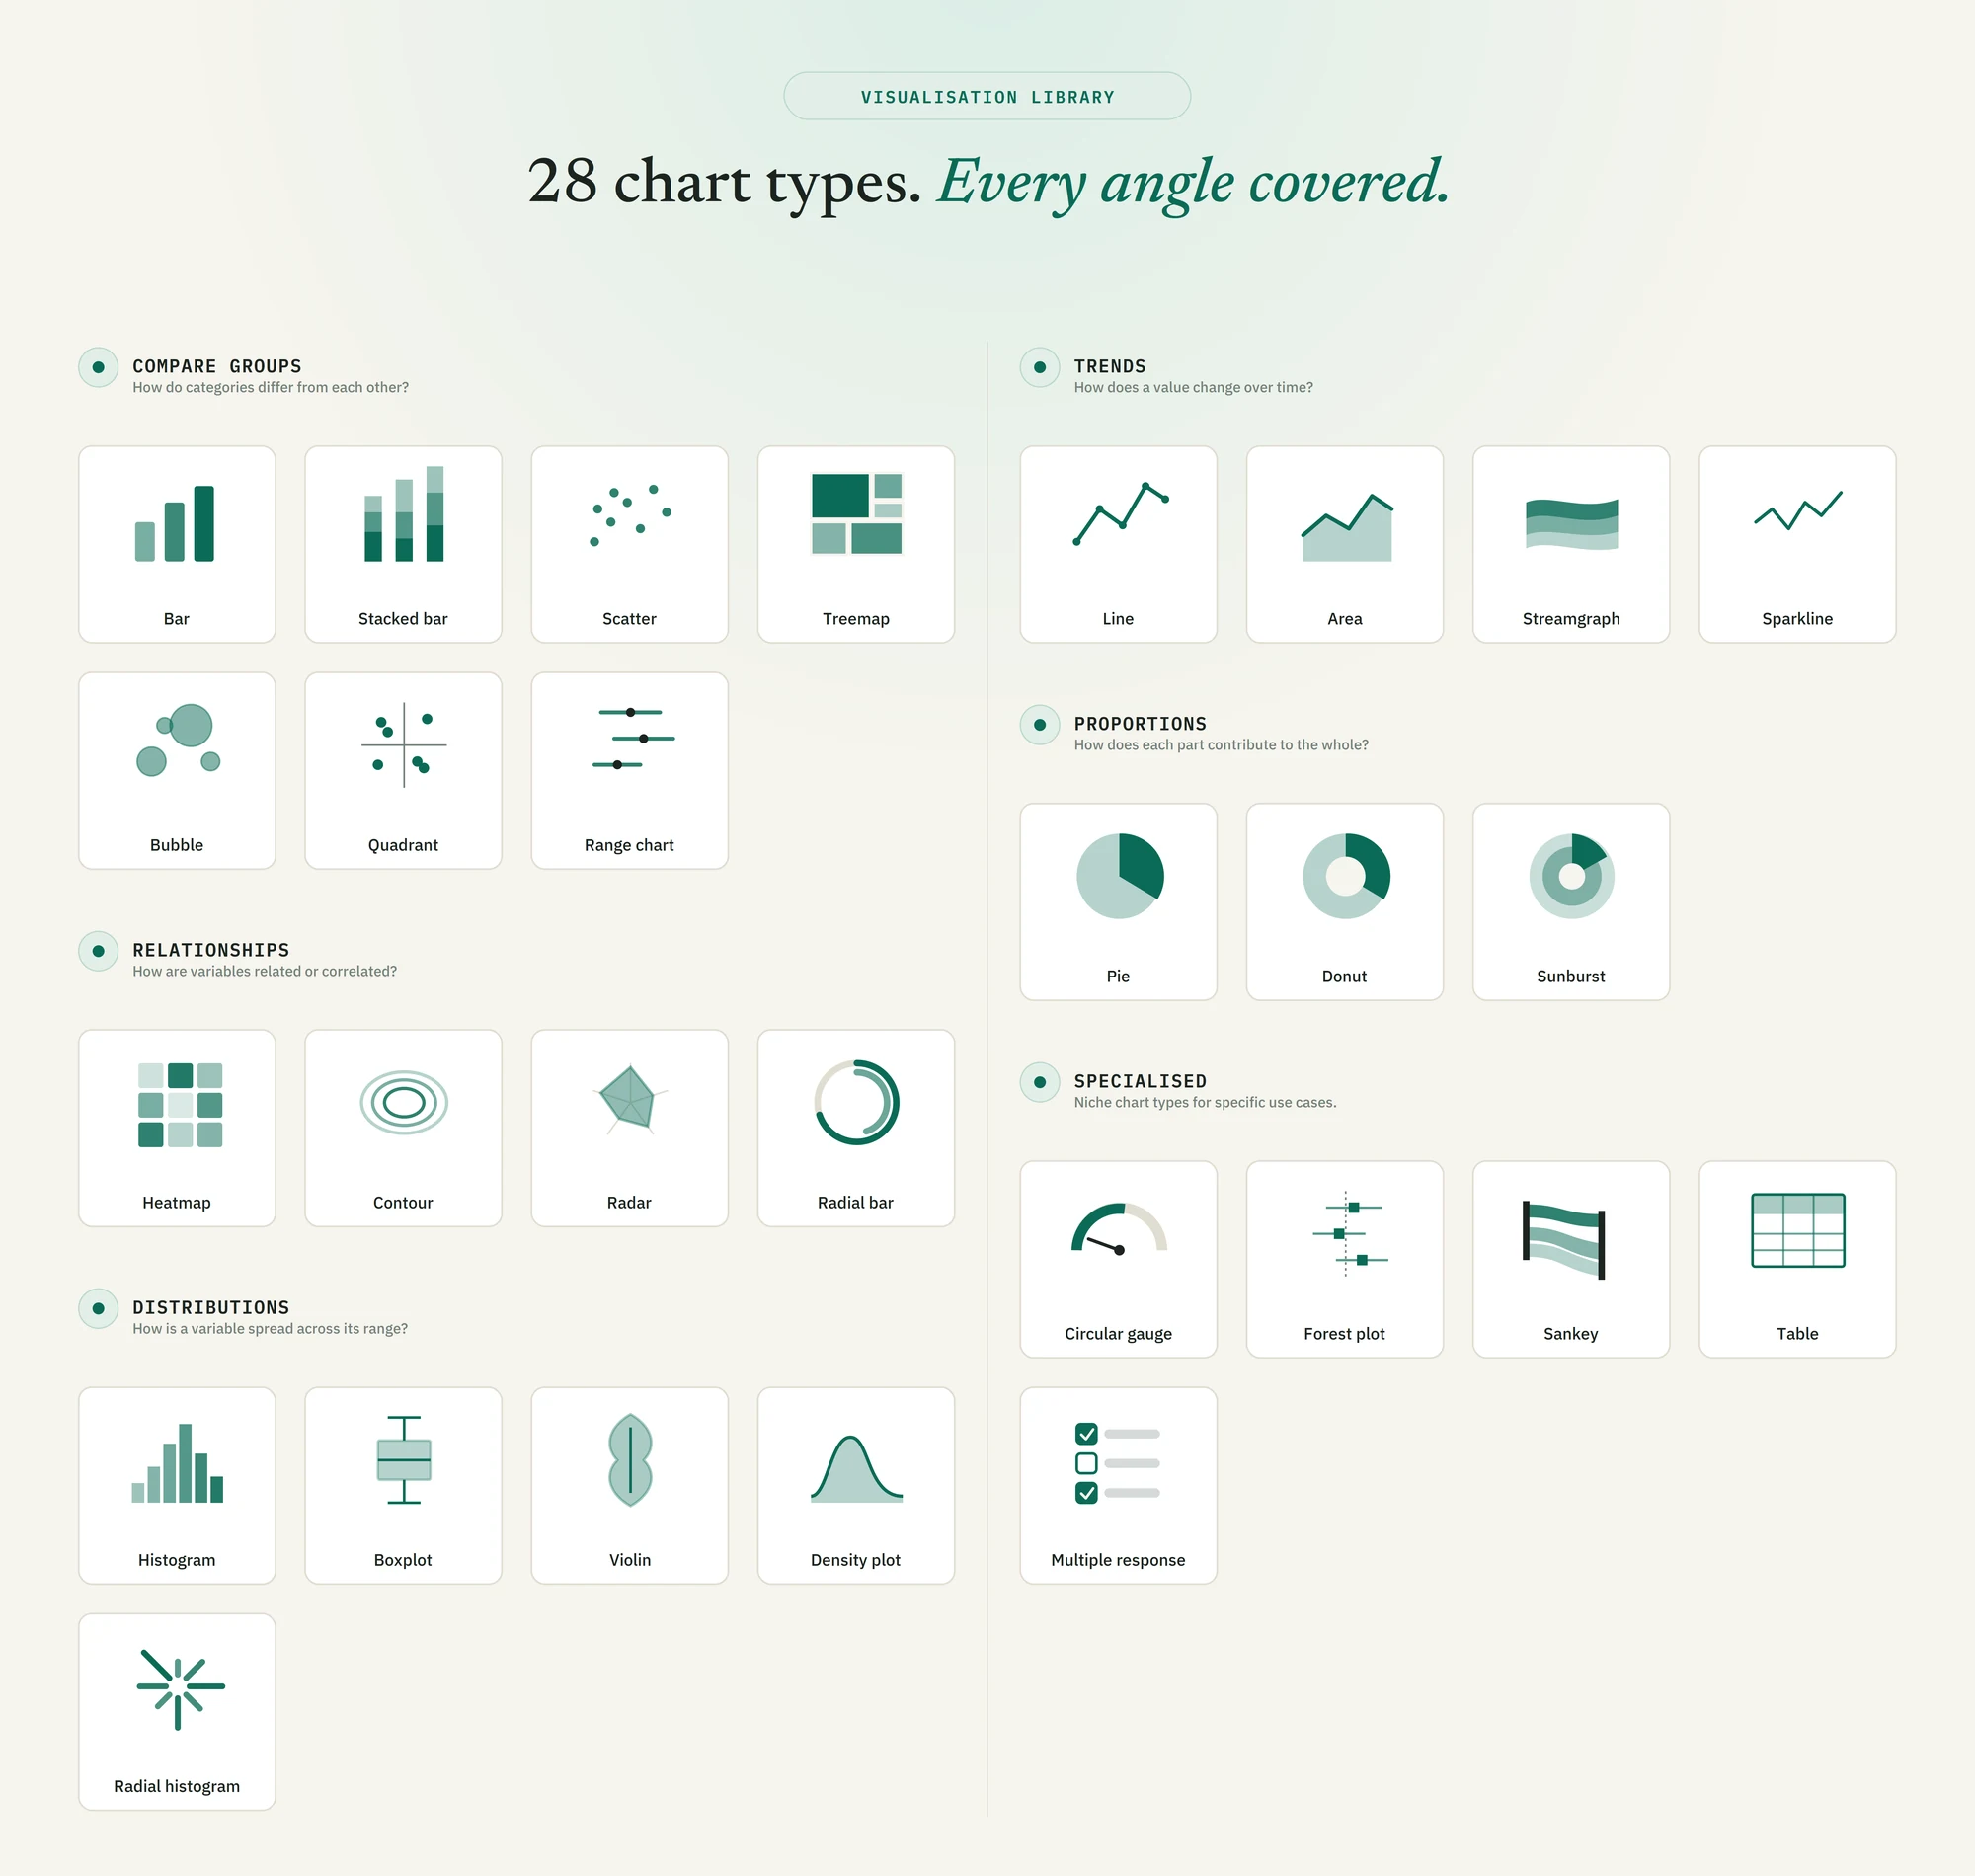
28 chart types in a grid you can arrange, where a click on one chart filters all the others.
Build a scrollable story from charts, tables, participant quotes and your own text, with an AI first draft of each slide.
Create an account and bring in your first file.
Create a free account